Maps Project- Potential Flooded Areas of Dams in the Magdalena River
Potential Flooded Areas of Dams in the Magdalena River by International Rivers
Explanations of Maps and Analysis
Prepared by: Charles Wight[1]
Of the many human-induced impacts facing rivers today, the construction of large hydroelectric dams disproportionally affects the tropics (World Commission on Dams 2000, Brandt 2000, McCully 2001). While dams are actually being removed in the global north, construction in the tropics is booming (McCully 2001, AmericanRivers.org).
The Magdalena River is the largest river system in Colombia with a watershed area of some 257,438 km2 (24% of Colombia) and is formed from 151 sub-basins garnering a total length of 1612 km (Restrepo 2006 c).
Economic development (Agriculture, Mining, Industry, Construction, Transport) in the 1970s and 1980s resulted in large-scale land-use changes that significantly affected the Magdalena basin (Restrepo et al. 2006 c). This is particularly noteworthy as some 79% of the population of Colombia lives within the Magdalena watershed (Restrepo et al. 2006 c).
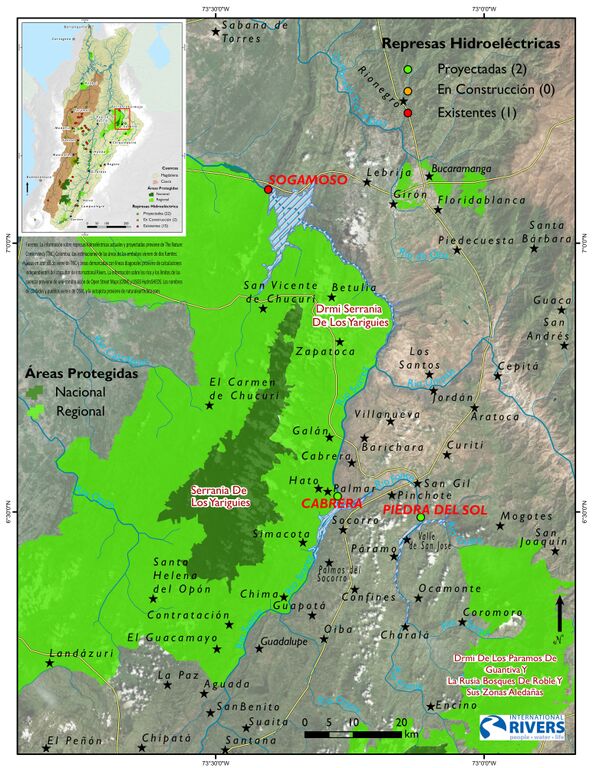
A looming danger faced by the Magdalena basin today is the increase of large hydroelectric dams planned along its main reach and large tributaries. In terms of large hydroelectric dams, data from The Nature Conservancy Colombia (TNC) suggests that within the Magdalena – Cauca basin there are 23 existing dams, 29 planned dams, and 4 dams under construction.
The purpose of this study is to provide preliminary analysis of the spatial extent of hydro-electric dams within the Magdalena Basin. The initial design is to focus on the Magdalena Basin, however, when possible data analysis includes the Cauca basin as well. Credit for the dam’s dataset is owed to The Nature Conservancy Colombia (TNC).
[1] Charles is a classically trained geographer from The University of Texas. For his Master's thesis he investigated dam impacts in the Amazon (fluvial) basin. His research Interests include: human impacts on rivers, hazards, remote sensing, water resources, participatory mapping, and climate change. charles@latinamericangeo.com
Datasets:
The dataset of dams used in this study come from The Nature Conservancy Colombia (TNC). Data for the hydrological networks was constructed using HydroSHEDS watershed boundaries at 15 second resolution (Lehner, B. and Grill G, 2013) overlaid on stream networks extracted from Open Street Maps (OSM). For information on protected areas, this study used the World Database on Protected Areas (WDPA). The WDPA is compiled by the United Nations Environment Programme and the IUCN, utilizing member organizations in 140 countries and has been doing so since 1981 (UNEP/IUCN 2009). The Digital Elevation Model (DEM) was based on publically available SRTM 30 meter resolution datasets. Data of towns, cities, municipalities and roadways came from www.naturalearth.com
Methodology:
In order to display the spatial extent of dams within the Magdalena Basin, this study constructed base-maps to include hydrological networks (rivers, and streams), digital elevation models (DEM) and geo-spatial data associated with political boundaries like city, towns, and departments. Once constructed, this base-map was blanketed by the dam’s dataset in order to perform spatial analysis as well as create reservoir areas upstream of each dam. In addition to analysis, a series of five maps were produced in order to provide perspective of dams in the Magdalena basin:
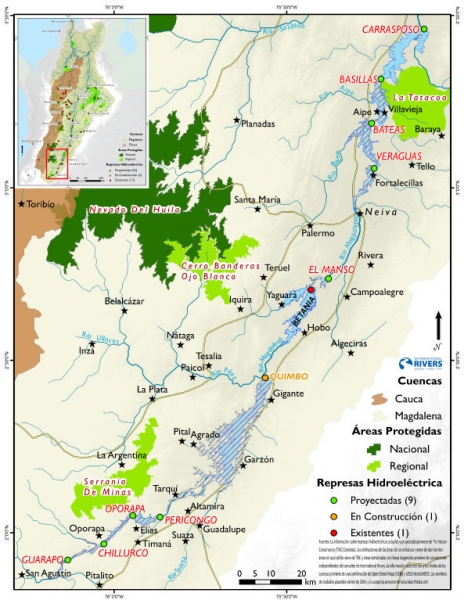
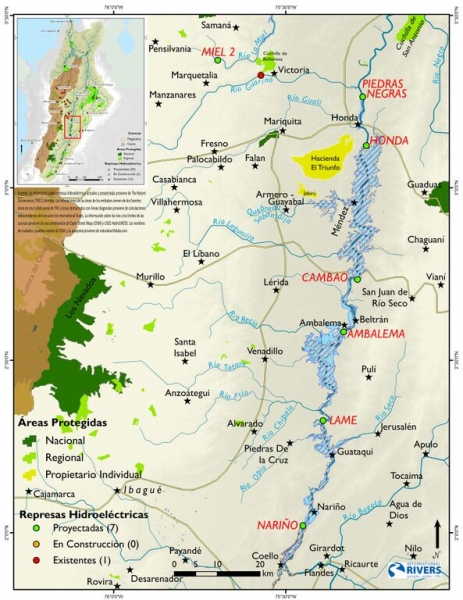
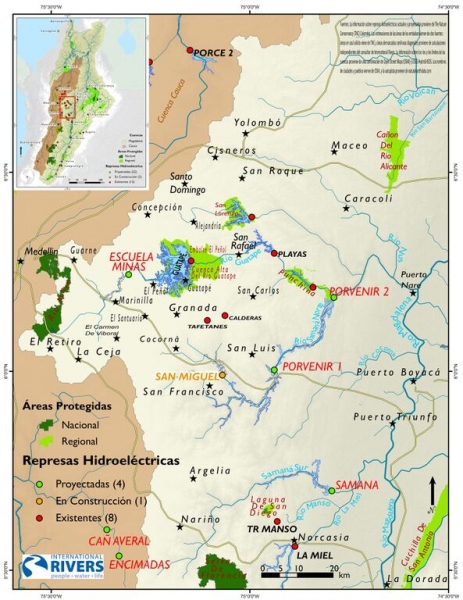
Main Map: Displays the entire extent of the Magdalena-Cauca basin. Highlighted within this map are the four red boxes which correspond to the four accompanying large scale / smaller area maps showing greater detail. The numbers are based on ascending order starting at the upper most section of the river. This map has a scale of 1: 4,000,000.
#1– Illustrates the upper most reaches of the Magdalena bounded by San Agustin, to Villavieja. This map has a scale of 1: 700,000.
#3 – Illustrates the third section downstream bound by La Dorada, Medellin, and Puerto Nare. This map has a scale of 1: 600,000.
Geographic extents of reservoirs upstream of planned dams are displayed in two layouts whenever possible. Solid blue polygons represent estimations made by The Nature Conservancy Colombia (TNC). Dashed blue/silver polygons are estimations made by a consultant at International Rivers. For these estimations, we interpolated 3m contour lines based off of the 30m DEM in Global Mapper. Next we calculated the elevation of each dam (ED) using extract by mask tool (spatial analyst) in ArcGIS 10.1 based on the previously mentioned DEM. Using the dam height (DH) found in the attributes of the dams dataset, we created a new column that added the DH to the ED to produce an elevation in meters above sea level that represented a rough estimation of the top of a dam. Selecting the closest contour less than the calculated value we were able to create a polyline representing the highest estimated elevation of water upstream a given dam before it would breach the spillway. Every dam and resultant reservoir was then exported to be checked manually in GoogleEarthPro to look for any inconsistencies within the results. Considering limitation related with both datasets e.g. interpolated contour lines based on (relatively coarse) 30 meter resolution and associated levels of uncertainty with the dam’s dataset, these estimated reservoir areas are meant to serve as rough approximations. We hope this in turn will start conversations about how one can obtain more accurate answers from those planning their construction.
Software:
The GIS analysis in this study was conducted using: ArcGIS 10.1/Arc Catalog, QGIS, Global Mapper and Google Earth Pro. Cartographic representations were enhanced using Inkscape 0.91.
References:
Brandt, S. A. (2000) Classification of geomorphological effects downstream of dams. Catena, 40, 375-401.
Lehner, B., & Grill, G. (2013). Global river hydrography and network routing: baseline data and new approaches to study the world's large river systems. Hydrological Processes, 27(15), 2171-2186.
McCully, P. 2001. Silenced rivers: the politics and ecology of large dams. London: Zed Books.
Open Street Maps (OSM). (2015, September 21). OpenStreetMap Foundation Wiki, . Retrieved 19:06, November 4, 2015 from http://wiki.osmfoundation.org/w/index.php?title=Main_Page&oldid=3376.
Restrepo, J.D., Kjerfve, B., (2000 )a. Water discharge and sediment load from the western slopes of the Colombian Andes with focus on Rio San Juan. J. Geol. 108, 17–33
Restrepo, J.D., Kjerfve, B., (2000 b). Magdalena River: interannual variability (1975–1995) and revised water discharge and sediment load estimates. J. Hydrol. 235, 137–149
Restrepo, J. D., & Syvitski, J. P. (2006) c. Assessing the effect of natural controls and land use change on sediment yield in a major Andean river: the Magdalena drainage basin, Colombia. Ambio: a Journal of the Human Environment, 35(2), 65-74.
Restrepo, J. D., Kjerfve, B., Hermelin, M., & Restrepo, J. C. (2006) b. Factors controlling sediment yield in a major South American drainage basin: the Magdalena River, Colombia. Journal of Hydrology, 316(1), 213-232.
World Commission on Dams. (2000). Dams and Development: A New Framework for Decision-making: the Report of the World Commission on Dams. Earthscan.
Latest additions:
Image Gallery

Contact Us
- Monti Aguirre
monti@internationalrivers.org
+1 (510) 848-1155 ext. 304
