Crunching the Hydro Numbers 2010: Fourth Quarter CDM Update
Mon, 12/27/2010 - 6:07pm
By:
Katy Yan
Due to the exuberant craziness that was Rivers for Life 3 , we skipped the Third Quarter CDM update and went straight to the Fourth Quarter. To read about which projects have been "naughty or nice" (well, mostly naughty and all worthy of a large lump of coal this holiday season), see our CDM Comments page.
Update:
- The number of hydro projects that entered the CDM pipeline dropped significantly after the second quarter (See Figs. 1 and 2).
- The
percent of registered projects that were involved in the review process
(which includes projects that require corrections) has been growing
over the years (see Fig. 4): 9.5% in 2005, 9.1% in 2006, 19.3% in 2007, 56.9% in 2008, 70.5% in 2009, 40.6% in 2010 (as of Dec 1, 2010).
- 55% of all hydro projects in the CDM pipeline have requested registration since 2004, while 47% of all hydro projects have actually been registered. Figs. 3 and 4 show the fate of projects requesting registration and being registered by year.
- Hydro projects continue to be the most prevalent type of project in the CDM pipeline (26% of all projects). 62% of credits expected from hydro projects come from China.
- Credits expected to be generated by large hydro (≥15 MW) by 2012 represent 16% of all credits expected to be generated by 2012. Reduction of refrigerant gases like HFCs still represent the largest project type (about a quarter). Fortunately, scrutiny of HFCs has increased thanks to the work of environmental groups like CDM Watch.
Click on the following graphs to see a larger version:
 Fig. 1: Projects at Validation by Quarter | 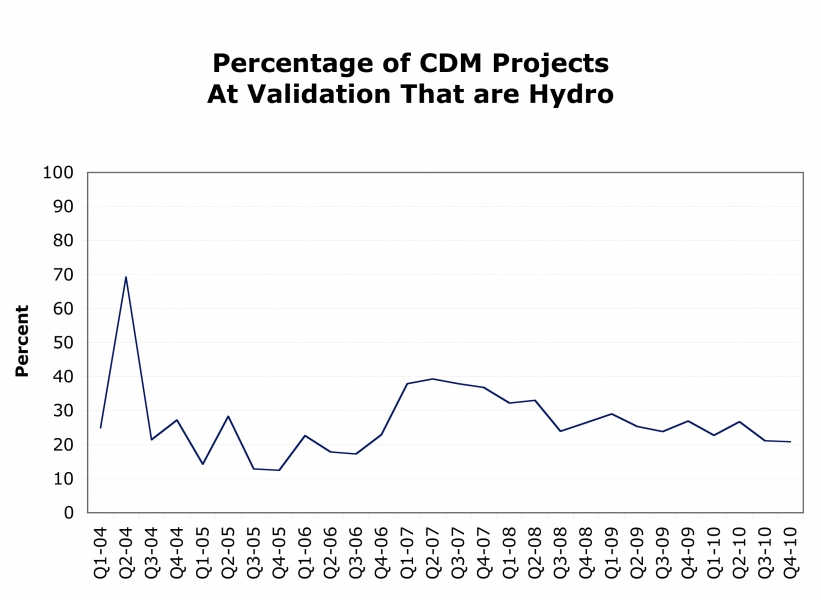 Fig. 2: Percentage of CDM projects at validation that are hydro |
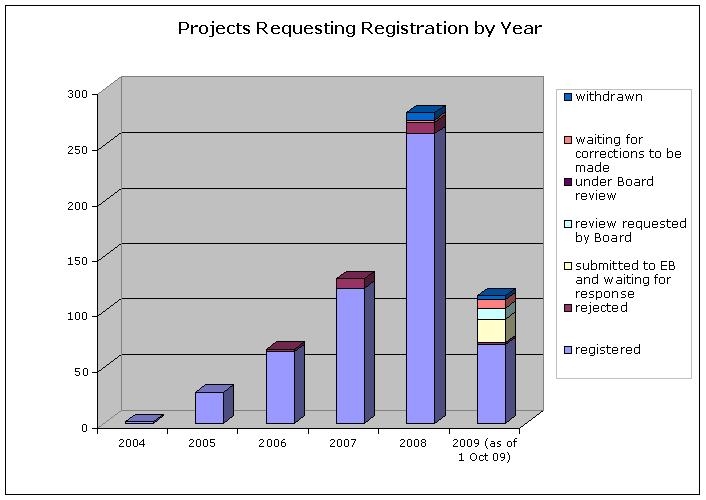 Fig. 3: Projects requesting registration by year | 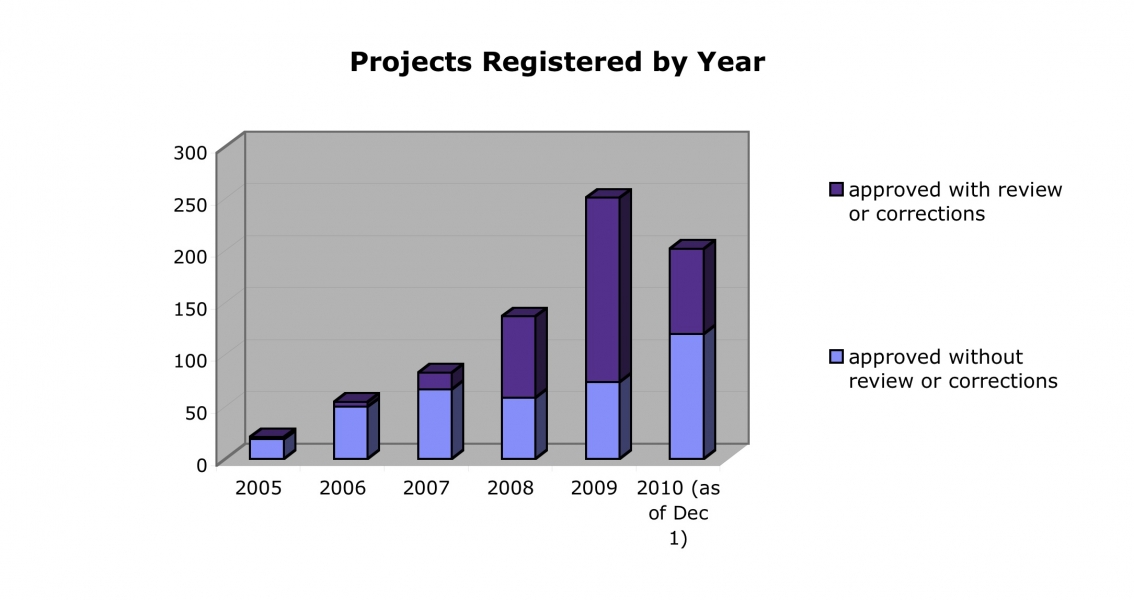 Fig. 4: Projects registered each year requiring a review or corrections |
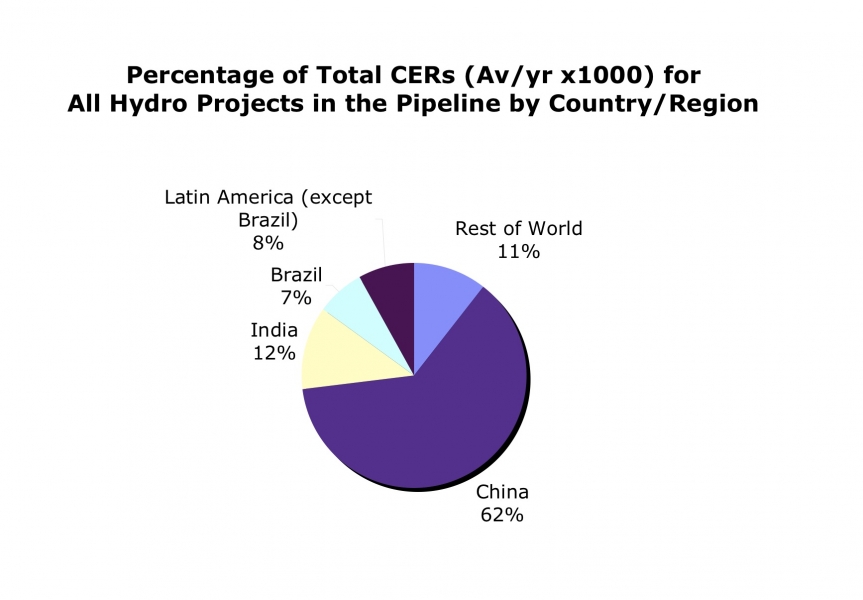 Fig. 5: Percent of total CERs for all hydro projects by country/region | 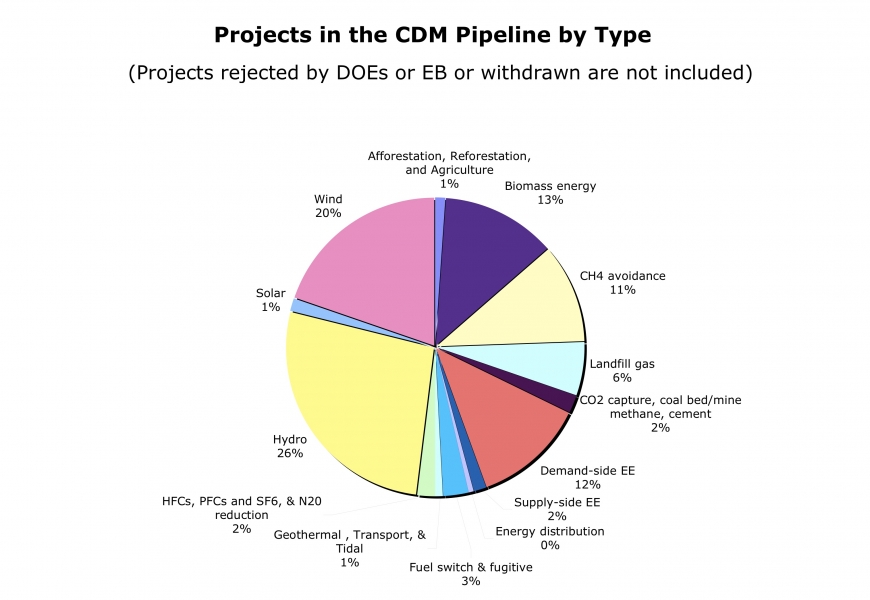 Fig. 6: CDM projects by type |
You can receive weekly email updates of new CDM hydro projects entering the pipeline and download our monthly spreadsheet by visiting our CDM spreadsheet page. Data is based on the UNEP Risoe spreadsheet (Dec 1, 2010) unless otherwise stated. Feel free to contact me about any of these calculations.
More information:
- To learn more about submitting comments on CDM project, including what issues to address in your comments, visit our CDM Public Comments page.
- For access to the latest spreadsheet and how you can sign up for weekly updates, go to our Hydro Spreadsheet page.